Friday, February 18, 2011

Data.Rescue@Home

I knew this was coming: crowdsourcing climate data.
Data.Rescue@Home is an internet-based attempt to digitize historical weather data from all over the globe and make the digitised data available to everybody. Two projects are currently online: German radiosonde data form the Second World War and meteorological station data from Tulagi (Solomon Islands) for the first half of the 20th century.
You log in, look at a scanned image of an old weather record, and enter the data as numbers on a form. 

Not much progress yet. Up and running since October 2010, but only about 150 of 2000 scanned images have been coded. Where are the masses when you need them?

New climate variability results: models and data, again

The New York Times reported yesterday on two new Nature papers on climate change (extreme precipitation events linked to anthropogenic global warming through computer simulation), expected to stir up debates again.

Meanwhile, a few weeks ago the 20th-Century Reanalysis Project reported on recent results of the longest-term weather data reanalysis project yet, collecting every scrap of available weather data from 1871-2008 and running them through a weather forecast model to "fill in the blanks" for what's missing.

A salient finding from this study: changes in the North Atlantic Oscillation (also see the North Atlantic Oscillation theme site) appear to be driven throughout the study period primarily by natural variability. In other words, the reanalysis isn't seeing an effect of global warming on variability in the NAO.

The reanalysis data go back to 1871 — but as they go back in time, they get thinner and thinner. Most data prior to the 1950s are from the surface only. The reanalysis model fills in the missing data. So the large majority of data in the pre-1950s reanalysis are created by the model.

Meanwhile, the Nature studies are looking at an entirely different kind of variability, i.e. frequency of extreme precipitation events in the UK (one study) and the Northern Hemisphere (the second study). (It's worth jumping to the actual articles from the links given on the Nature news page.) These studies compare observational data with results from simulation models with and without anthropogenic forcing (i.e. greenhouse gases and other human influences on climate). The results: (a) natural variability alone can't account for the increased northern hemisphere precipitation in the second half of the 20th century, and (b) anthropogenic factors, added to the simulation models, doubled the risk of the floods experienced in the UK in 2000.

This, combined with the comments on the two Nature pieces, make for a lovely skeptic paradox. The skeptics are very happy with the results from the model-driven reanalysis data which (they think) confirm their views. (Another nail in the coffin of AGW, one wrote.) But they roundly reject the idea that simulation models could explain the significant increase in extreme precipitation.

By the way, Piers Corbyn, mentioned in the Kevin Crean comment on the Nature news page, runs a commercial long-term weather prediction service in the UK using his own "solar/lunar" model, whose details he will not reveal and which has never been peer reviewed. He's had some notable successes in forecasting major storms long in advance (months). He places bets on his own forecasts (and sometimes wins). He's a skeptic in the Christopher Monckton vein. (Monckton, by the way, claims to be a hereditary member of the House of Lords, but the Lords are having none of it.)

I'm going to be working on an op-ed about this over the weekend. Comments welcome.


Friday, January 28, 2011

UN panel sees low/no-cost path to massive greenhouse gas cuts

Here's what could be good news if policymakers were paying attention. The UN Industrial Development Organization (UNIDO) reported a few days ago that a relatively inexpensive combination of renewable energy and energy-efficiency improvements could go far to meeting emissions reduction goals related to climate change, potentially buying time to introduce carbon capture and storage technologies. 
Cost-effective renewable energy could supply 21 per cent of all industrial energy by 2050, providing ten per cent of all reductions needed to counter a potential future of devastating droughts, floods, desertification, rising oceans, ever more powerful storms, shrinking glaciers and other possible effects of climate change.

At nearly two gigatonnes of CO2, this represents 25 per cent of the total expected emission reductions of the industry sector – equivalent to the total current CO2 emissions of France, Germany, Italy and Spain, or around one third of current emissions in the United States.

Industrial energy efficiency potential worldwide amounts to 26 per cent, with that in developing countries nearly twice as high as in developed nations, according to the reports. [news article; full report]
The industrial efficiency measures, in particular, are no-brainers or what are sometimes called "no-regrets" strategies, since they cut industry costs while saving energy (and reducing carbon outputs) at the same time. The report notes that renewable sources won't be cost-competitive in places (such as the USA...) where fossil fuels are subsidized. If subsidies are eliminated, renewables are already competitive, and they're already clear winners where carbon outputs are priced.

Note that this isn't the Intergovernmental Panel on Climate Change, but an unrelated UN agency.

Wednesday, January 19, 2011

~1000 ppm and ~30°C global average temps by 2100?

In this week's Science, NCAR climatologist Jeff Kiehl presents the case that when Earth's atmosphere hits 1000 ppm of carbon dioxide — which will happen around 2100 on a business-as-usual scenario — the global average temperature will reach 30°C. That's about twice today's global average of ~16°C. He bases this conclusion on what's known about previous periods in Earth's history over the last 100 million years.

30°C would amount to a re-run of the Cretaceous, with most surface ice melted away and huge increases in sea level.

Kiehl is no credulous consumer of model results. A few years ago, he was a vocal critic of the practice of tuning climate models. He raised the question of how overall climate model projections for CO2 doubling varied by only a factor of two, when those same models contained critical aerosol submodels that varied by a factor of three.

Here's his argument:
The atmospheric CO2 concentration currently is 390 parts per million by volume (ppmv), and continuing on a business-as-usual path of energy use based on fossil fuels will raise it to ∼900 to 1100 ppmv by the end of this century ...Recent reconstructions of atmospheric CO2 concentrations through history indicate that it has been ∼30 to 100 million years since this concentration existed in the atmosphere... The data also reveal that the reduction of CO2 from this high level to the lower levels of the recent past took tens of millions of years. Through the burning of fossil fuels, the atmosphere will return to this concentration in a matter of a century. Thus, the rate of increase in atmospheric CO2 is unprecedented in Earth's history. [full article]
Kiehl goes on to discuss what happened at a previous CO2 peak of ~1000 ppm, around 35 million years ago. That peak resulted in tropical warming of 5° to 10°C, and much more warming in the polar regions — up to 15°-20°C. (Global warming is well understood to vary by latitude, with the poles warming far more than the equator. That's because the climate system functions to transport incoming solar heat to the poles, where more of it can be re-radiated into space.)
What can we learn from Earth's past concerning the climate's sensitivity to greenhouse gas increases? Accounting for the increase in CO2 and the reduction in solar irradiance, the net radiative forcing—the change in the difference between the incoming and outgoing radiation energy–of the climate system at 30 to 40 Ma [million years ago] was 6.5 to 10 W m−2 with an average of ∼8 W m−2. A similar magnitude of forcing existed for other past warm climate periods, such as the warm mid-Cretaceous of 100 Ma. ...The global annual mean temperature at this time can be estimated to be ∼31°C, versus 15°C during pre-industrial times (around 1750). Thus, Earth was ∼16°C warmer at 30 to 40 Ma. 
Kiehl finishes with a disturbing conclusion. It may be, he suggests, that model calculations of the climate's sensitivity to greenhouse gases have underestimated that sensitivity by a factor of two or more. If true, our grandchildren — even, for many of us, our children — are in for a truly cataclysmic heat wave.

Saturday, January 15, 2011

Science review of A Vast Machine

A review by Richard Somerville just came out. You can see it here.

In the same review, Somerville discusses philosopher Eric Winsberg's new book Science in the Age of Computer Simulation. Winsberg is one of a few intrepid philosophers who have taken up the challenge of understanding the logic of simulation and modeling, which lie at the core of modern science (and which I discuss extensively in A Vast Machine.)

From the review:
Winsberg suggests that philosophy of [contemporary] science... ought to concern itself with the subject of simulating complex phenomena within existing theory, as opposed to its traditional focus on the creation of novel scientific theories. Winsberg concludes,
[W]hat we might call the ontological relationship between simulations and experiments is quite complicated. Is it true that simulations are, after all, a particular species of experiment? I have tried to argue against this claim, while at the same time insisting that the differences between simulation and experiment are more subtle than some of the critics of the claim have suggested. Most important, I have tried to argue that we should disconnect questions about the identity of simulations and experiments from questions of the epistemic power of simulations.
Philosophy has been trailing the actual state of science for a long time now, so it's good to see this kind of work coming out.

I'm afraid, though, that it's still trailing the bleeding edge — we've entered an age of data-intensive science, which presents its own epistemic challenges: for example, how much does theory matter when statistical analysis of huge datasets reveals strong correlations? If predictive power is your main goal, sometimes data can take the place of explanation. (Not sure I actually believe this, but it's a compelling point of view.) Take a look at Hey et al., The Fourth Paradigm if this kind of thing interests you.

Friday, January 14, 2011

If the globe is warming, why is it snowing so much?

Georgia and Florida hardly ever get snow, but they got dumped on this week. 49 out of the 50 states, in fact, had snow. What's going on?

Simple answer on the global scale: warmer air means more evaporation from oceans, lakes and rivers. More evaporation means there's more water in the air — so more precipitation (including snow) is to be expected. Snow is just frozen rain.

On local and regional scales, though, the real question isn't "why is it snowing?" but "why is it cold?" Strangely enough, here too the best answer may be "because of global warming."

Here's a very clear explanation by Judah Cohen in the New York Times:
...the overall warming of the atmosphere is actually creating cold-weather extremes. Last winter, too, was exceptionally snowy and cold across the Eastern United States and Eurasia, as were seven of the previous nine winters.

For a more detailed explanation, we must turn our attention to the snow in Siberia.

Annual cycles like El NiƱo/Southern Oscillation, solar variability and global ocean currents cannot account for recent winter cooling. And though it is well documented that the earth’s frozen areas are in retreat, evidence of thinning Arctic sea ice does not explain why the world’s major cities are having colder winters.

But one phenomenon that may be significant is the way in which seasonal snow cover has continued to increase even as other frozen areas are shrinking. In the past two decades, snow cover has expanded across the high latitudes of the Northern Hemisphere, especially in Siberia, just north of a series of exceptionally high mountain ranges, including the Himalayas, the Tien Shan and the Altai.

The high topography of Asia influences the atmosphere in profound ways. The jet stream, a river of fast-flowing air five to seven miles above sea level, bends around Asia’s mountains in a wavelike pattern, much as water in a stream flows around a rock or boulder. The energy from these atmospheric waves, like the energy from a sound wave, propagates both horizontally and vertically.

As global temperatures have warmed and as Arctic sea ice has melted over the past two and a half decades, more moisture has become available to fall as snow over the continents. So the snow cover across Siberia in the fall has steadily increased.

The sun’s energy reflects off the bright white snow and escapes back out to space. As a result, the temperature cools. When snow cover is more abundant in Siberia, it creates an unusually large dome of cold air next to the mountains, and this amplifies the standing waves in the atmosphere, just as a bigger rock in a stream increases the size of the waves of water flowing by.

The increased wave energy in the air spreads both horizontally, around the Northern Hemisphere, and vertically, up into the stratosphere and down toward the earth’s surface. In response, the jet stream, instead of flowing predominantly west to east as usual, meanders more north and south. In winter, this change in flow sends warm air north from the subtropical oceans into Alaska and Greenland, but it also pushes cold air south from the Arctic on the east side of the Rockies. Meanwhile, across Eurasia, cold air from Siberia spills south into East Asia and even southwestward into Europe.

That is why the Eastern United States, Northern Europe and East Asia have experienced extraordinarily snowy and cold winters since the turn of this century. Most forecasts have failed to predict these colder winters, however, because the primary drivers in their models are the oceans, which have been warming even as winters have grown chillier. They have ignored the snow in Siberia.
...It’s all a snow job by nature. The reality is, we’re freezing not in spite of climate change but because of it.
Full article is here.

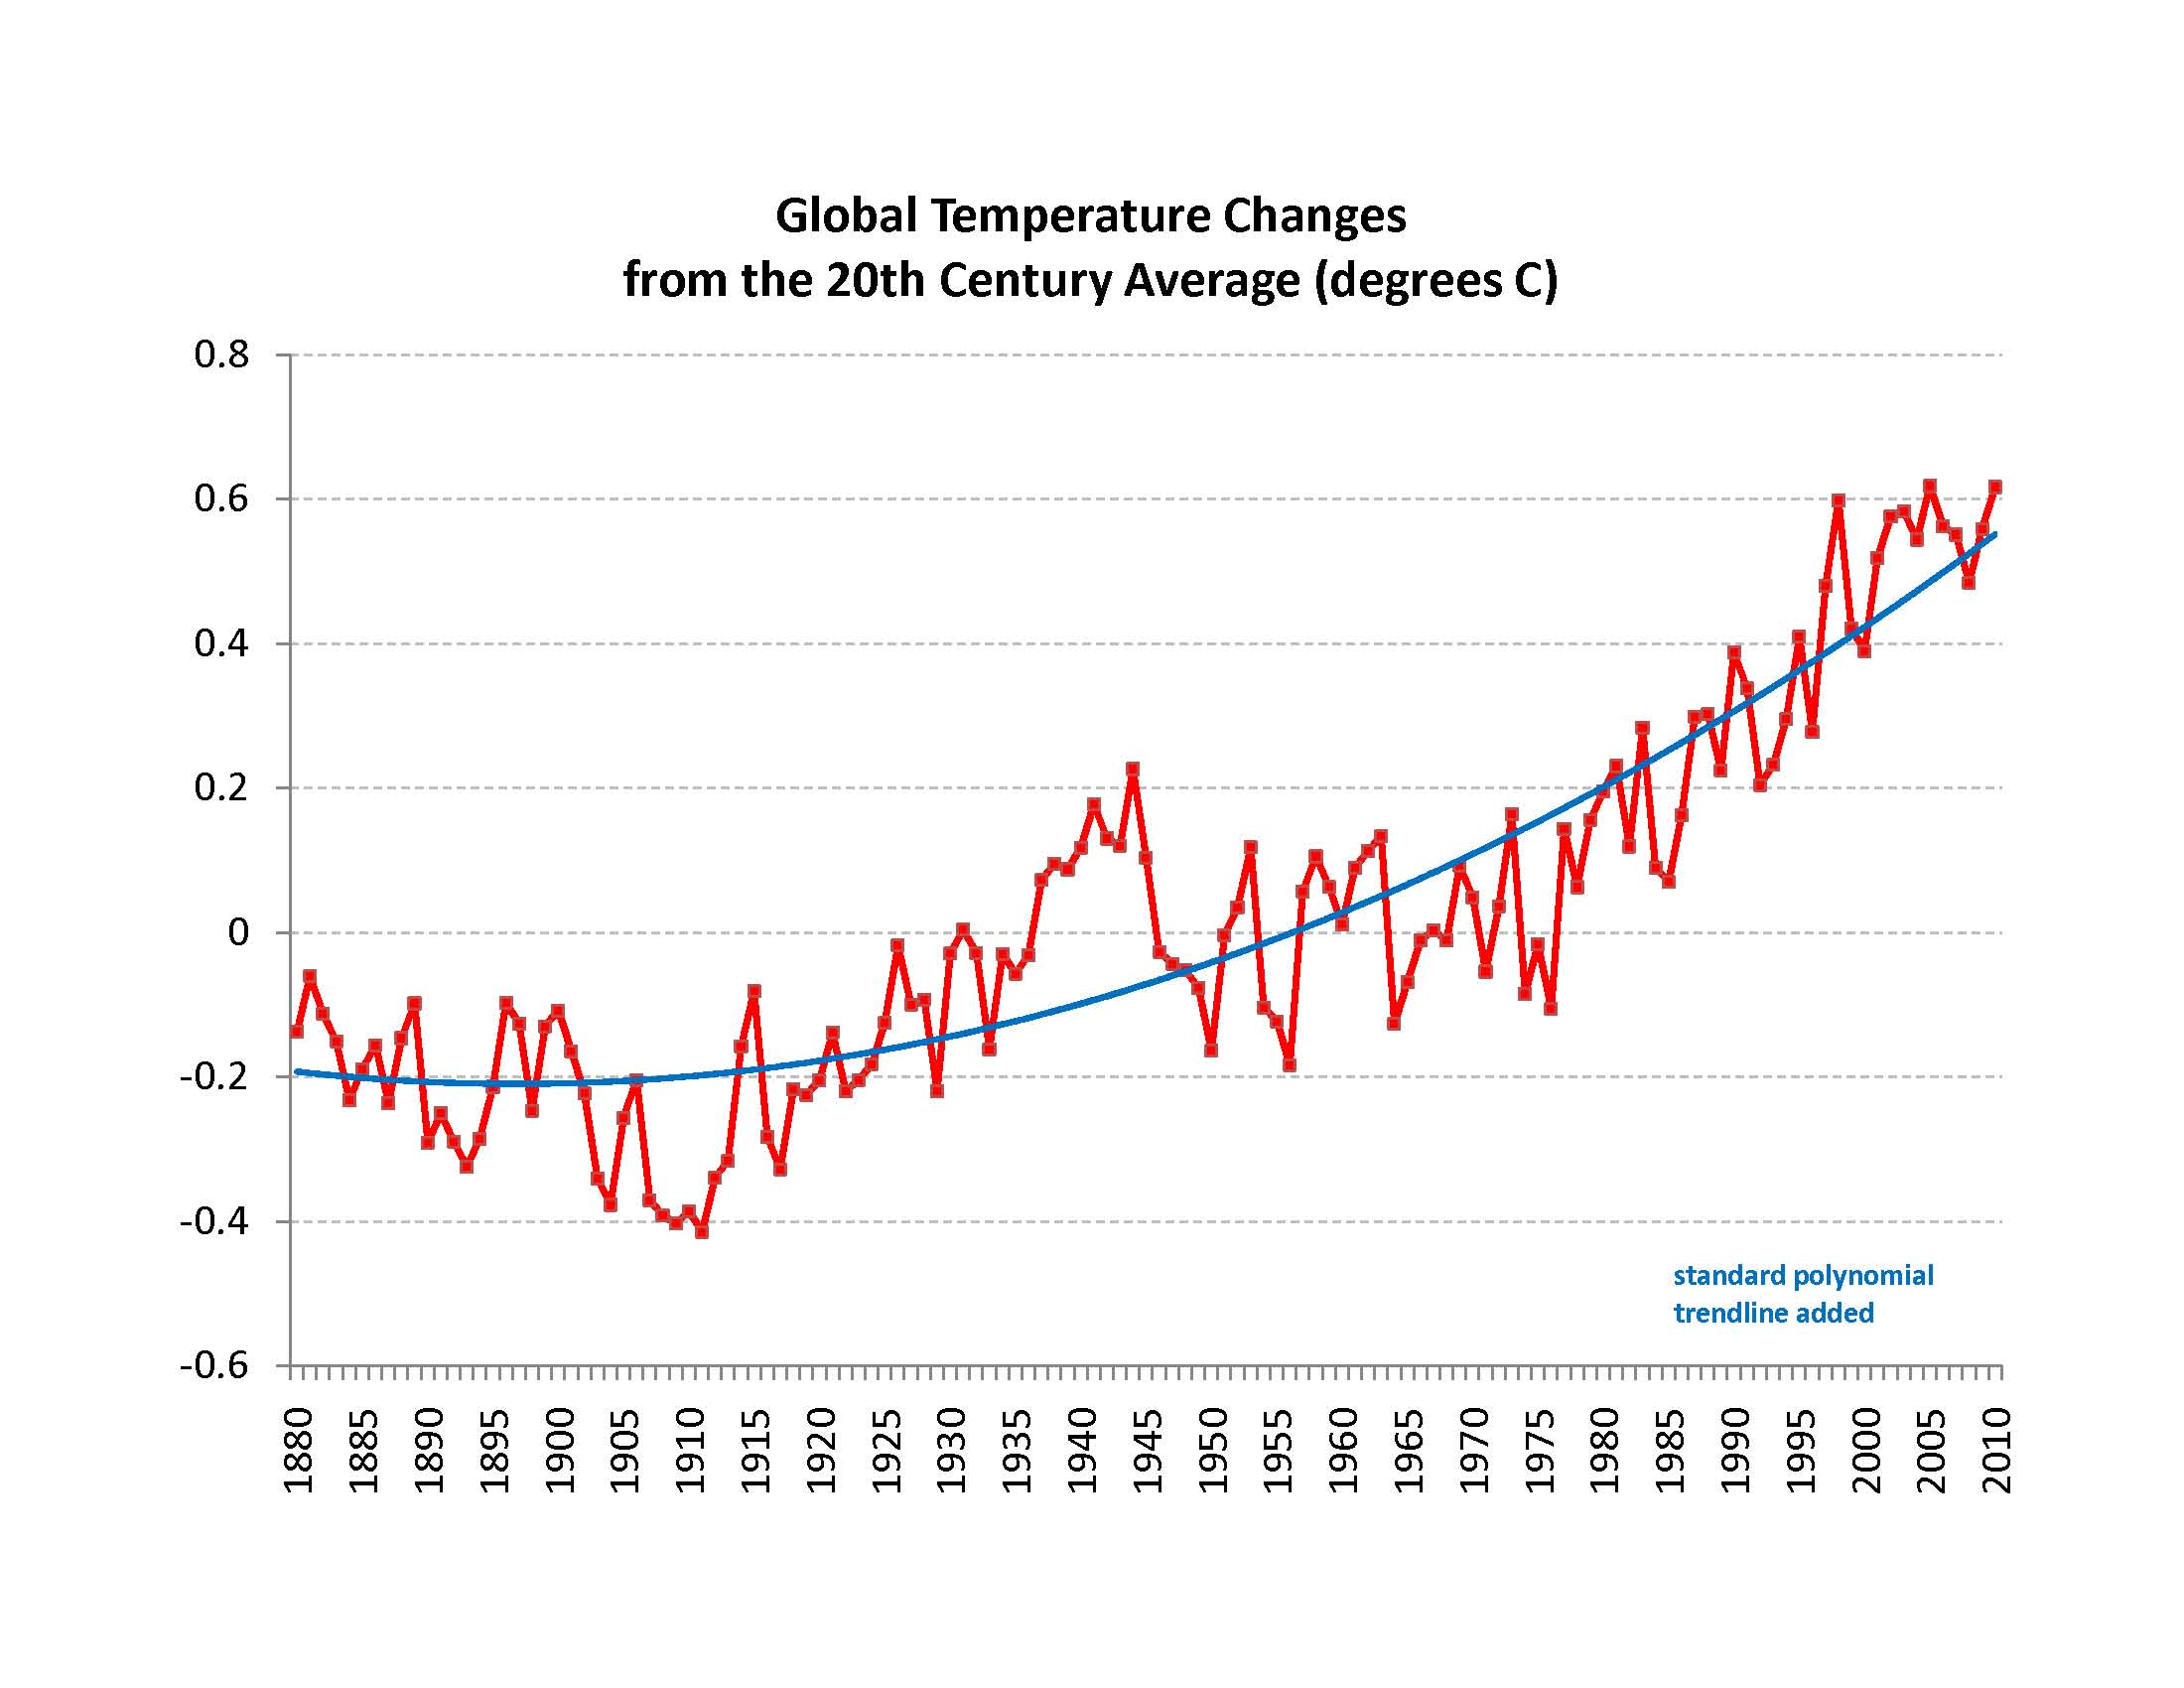
2010: the hottest year on record


 The graph says it all, really, but if you want to know more, see Peter Gleick's article in the Huffington post.