Yesterday I gave a talk on communicating with non-scientists about climate change, at the 2011 Stephen Schneider Symposium in Boulder. (My slides from the talk.) Preparing the talk got me thinking about metaphors, images, and ideas that can get across the nature and severity of climate change to people who aren't experts and don't know what to make of numbers and graphs. Today's post will be first in a series on this.
In 2007, the Extreme Ice Survey set up 38 time-lapse cameras on 22 glaciers around the world. These are mostly very cold, remote places, so the cameras are automatic.
Just four years later, the results are astonishing.
Some of the cameras had to be moved, multiple times, as the glacier faces moved miles upstream. We are talking about colossal rivers of ice that took centuries to form, diminishing and even disappearing completely in the space of a few decades.
Here's a 1-minute video of the Kadin glacier in Alaska, 2007-2010:
AK-01 Columbia Kadin Narrated from Extreme Ice Survey on Vimeo.
Since the 1990s, 95 percent of the world's glaciers are in retreat. Better than any human instrument, they show directly, and radically, the state of planetary warming and the difference just a couple of degrees can make.
Passing through the Denver airport, I saw videos from the Extreme Ice Survey playing on the intra-terminal train platform. What a great way to put this out there for everyone to see!
Saturday, August 27, 2011
Monday, May 2, 2011
Tornadoes and climate change
One of my friends wanted to know what I thought about tornadoes and global warming. Here's my basic line; this applies to any kind of extreme weather.
Temperature is a measure of energy. So higher average temperatures mean that there's more energy in the global system. The function of the climate system is to balance incoming solar radiation and outgoing heat. It does that by moving energy from the equator (where the most radiation comes in) to the poles (where the most heat goes out). Winds — including the winds that cause tornadoes — are one manifestation of moving energy.
Now - you can never attribute any particular weather event, or even a series of apparently related events like these tornadoes, directly to climate change, because weather is so highly variable and chaotic. Only changes in averages are actually climatic.
The relationship between tornadoes and climate is especially hard to analyze since they're highly local phenomena (unlike hurricanes, which occur on a much larger physical scale). This year's tornado series may or may not be the beginning of a trend — we don't know, and we can't know for a number of years. On the other hand, it's certainly plausible that they are part of a trend. Same thing for hurricanes, snowstorms, and other extreme phenomena: we don't know for sure yet, but there's an obvious intuitive connection between higher numbers of more energetic events and increasing energy in the overall climate system.
Laura Gottesdiener did a nice report on this at Huffington Post Green. Here's an extract:
A 2008 report from the U.S. Global Change and Research Program, a federal interagency research program overseen by the White House Office of Science and Technology Policy, found that more greenhouse gases in the atmosphere could lead to an increase in severe storm conditions that make tornadoes possible. "We can’t say there is a correlation between a specific tornado and global change," said program director Thomas Armstrong. "But the reports do indicate that there is a positive correlation between climate change and the frequency of conditions favorable to the formation" of tornadoes, he said, while stressing that the research is still preliminary.Sound about right to me. Basically, if you like making bets on low odds, this could be a good one to get in on.
Tuesday, March 22, 2011
Climate smackdown: data versus models?
For decades, skeptics have tried to boil every climate change debate down to this: good, hard data vs. bad, fuzzy models. This caricature lets them attack every model-based climate projection while waiting for data to confirm the reality of human-induced global warming.
Now, here we go again. On February 10, the Wall Street Journal’s professional global warming skeptic, Anne Jolis, trumpeted recent data showing that certain global climate patterns haven’t changed much since 1871. “The weather isn’t getting weirder. The latest research belies the idea that storms are getting more extreme," she wrote, to loud applause from other skeptics. “Another nail in the coffin of anthropogenic global warming,” crowed one.
Less than a week later, the scientific journal Nature presented two papers suggesting that human greenhouse gas emissions have increased the likelihood of heavy rains. One linked the devastating UK floods of the year 2000 to global warming [see it here]. The other identified greenhouse gas emissions as a likely contributor to increases in exceptionally heavy “precipitation events” across the northern hemisphere [see it here]. These results confirm the obvious: a warmer climate leads to more evaporation, and hence more precipitation overall. But they went further, predicting where this extra precipitation would occur and linking it specifically to human emissions.
Both Nature papers relied on climate models, computer simulations of the global atmosphere. When researchers left human greenhouse-gas emissions out of these simulations — simulating the climate as it might be without industrial societies — their models projected fewer heavy precipitation events than observed. When they put them back in, the likelihood of intense precipitation went up.
The skeptic response? “No real data supporting their claims,” one wrote on Andy Revkin's Dot Earth blog. “Just climate models. GIGO [garbage in, garbage out].”
It’s a familiar refrain in the climate change wars. Climate models, goes the tune, are insubstantial fantasies. Tweak their knobs and you can make ‘em say anything. Climate data, on the other hand, are solid, substantial. “Sound science” equals “data, not models.”
But wait — about those data that made Jolis so happy... where exactly did they come from? Here’s a hint: the investigators were awarded over 3 million hours of supercomputer time to do their work. It’s called the 20th-Century Reanalysis Project (20CR, for short). “Reanalysis” is a technique for re-processing past weather data to make a climate dataset.
Here's the paper that got her so jazzed. 20CR began with a comprehensive collection of surface pressure readings covering the period 1871-2008. The project then spent some of those millions of supercomputer hours to pipe those data through a computer forecast system — a simulation model.
That forecast model uses a 3-dimensional grid to represent the atmosphere. The grid mesh contains well over 1 million points, and every one of those points must be assigned a value. Yet the surface pressure readings used as input came from a relative handful of locations — for 1871, the study’s first year, only 62 land stations worldwide. In reanalyses of this type, the vast majority of data are calculated by the forecast model, not measured by instruments.
So the “data” that had Jolis gloating were in fact largely generated by a computer simulation — the same type of model (though not the same model) used in the Nature studies. According to some skeptics’ own tenets, then, the 20CR data can’t be much more than a scientific fantasy.
True? Of course not. Getting a scientific grip on something as big and complicated as the global atmosphere simply can’t happen without computer modeling. Today, every credible global dataset, without exception, is processed, filtered, corrected, and/or partially generated by computer models. Those who think it’s data versus models — hard evidence vs. squishy algorithms — are living in a long-vanished world, where “science” meant laboratory experiments on highly simplified systems.
So who’s right? Are human greenhouse emissions altering the chances of extreme weather, as the Nature papers suggest? Or does natural climate variability remain unchanged, as 20CR seems to show? Unfortunately, that question can’t yet be answered, because 20CR and the Nature studies addressed different climate patterns that can’t be directly compared. One thing is sure, though: it’s going to take both observations and computer models to find out. Everything we know about the climate — past, present, and future — depends upon our ability to simulate its operation.
The idea that it’s “models bad, data good” just won’t work. We can’t let the skeptics set the terms of the debate. They don’t even understand what the terms mean.
Coda:
As for the 20CR scientists, they responded to Jolis on Feb. 23. Mild-mannered creatures that they are, they wrote that her opinion "does not accurately reflect our views."
As for the statement that the Twentieth Century Reanalysis Project... shows 'little evidence of an intensifying weather trend': We did not look at weather specifically, but we did analyze three weather and climate-related patterns that drive weather, including the North Atlantic Oscillation. And while it is true that we did not see trends in the strength of these three patterns, severe weather is driven by many other factors.They fail to point out that their analysis is itself produced by a model.
The lack of a trend in these patterns cannot be used to state that our work shows no trend in weather. Many researchers have found evidence of trends in storminess and extreme temperature and precipitation in other weather data over shorter periods.
Finally, the article notes that the findings are 'contrary to what models predict.' But models project forward, while our analysis looked back at historical observations. We see no conflict between the 100-year-projection of changes in weather extremes resulting from additional carbon dioxide and the fact that our look back at three indicators showed no historical trend.
Tuesday, March 8, 2011
Fact-free science
Been meaning to write a post about Judith Warner's great piece "Fact-Free Science," in the NY Times Magazine of February 27.
For the last couple of months, I've been subscribing to Google News Alerts on the terms "global warming" and "climate change." If you want to get depressed, do this; I would say that at least 40 percent of this "news" is articles skeptical of anthropogenic global warming. These come now from all over the world, with a substantial percentage of them emanating from India. Almost none of these articles cite new scientific findings; they recycle the same old, already answered false claims about cosmic rays, solar influence, Little Ice Age "recovery" (an idea with no physical basis at all), and so on.
To avoid having to shoot yourself after reading this stuff, look at skepticalscience.com, the best clear, simple, well-evidenced source for evaluation of skeptic claims.
“This is our generation’s Sputnik moment,” President Obama declared in his State of the Union address last month.In a 2008 Gallup Poll, 63 percent of Americans said they thought the effects of global warming were already visible. In 2010, that number went down to 53 percent. It's now an article of faith in the Republican Party that climate change is either not happening, or not caused by human activity.
It would be easier to believe in this great moment of scientific reawakening, of course, if more than half of the Republicans in the House and three-quarters of Republican senators did not now say that the threat of global warming, as a man-made and highly threatening phenomenon, is at best an exaggeration and at worst an utter “hoax,” as James Inhofe of Oklahoma, the ranking Republican on the Senate Environment and Public Works Committee, once put it. These grim numbers, compiled by the Center for American Progress, describe a troubling new reality: the rise of the Tea Party and its anti-intellectual, anti-establishment, anti-elite worldview has brought both a mainstreaming and a radicalization of antiscientific thought.
For the last couple of months, I've been subscribing to Google News Alerts on the terms "global warming" and "climate change." If you want to get depressed, do this; I would say that at least 40 percent of this "news" is articles skeptical of anthropogenic global warming. These come now from all over the world, with a substantial percentage of them emanating from India. Almost none of these articles cite new scientific findings; they recycle the same old, already answered false claims about cosmic rays, solar influence, Little Ice Age "recovery" (an idea with no physical basis at all), and so on.
To avoid having to shoot yourself after reading this stuff, look at skepticalscience.com, the best clear, simple, well-evidenced source for evaluation of skeptic claims.
Interview with me in Rorotoko
The intellectual book review Rorotoko published an online "interview" with me yesterday morning (March 7).
My attempt to boil down some of the main points of A Vast Machine to a conversational format.
Friday, February 18, 2011
Data.Rescue@Home
I knew this was coming: crowdsourcing climate data.
Data.Rescue@Home is an internet-based attempt to digitize historical weather data from all over the globe and make the digitised data available to everybody. Two projects are currently online: German radiosonde data form the Second World War and meteorological station data from Tulagi (Solomon Islands) for the first half of the 20th century.
You log in, look at a scanned image of an old weather record, and enter the data as numbers on a form.
Not much progress yet. Up and running since October 2010, but only about 150 of 2000 scanned images have been coded. Where are the masses when you need them?
New climate variability results: models and data, again
The New York Times reported yesterday on two new Nature papers on climate change (extreme precipitation events linked to anthropogenic global warming through computer simulation), expected to stir up debates again.
Meanwhile, a few weeks ago the 20th-Century Reanalysis Project reported on recent results of the longest-term weather data reanalysis project yet, collecting every scrap of available weather data from 1871-2008 and running them through a weather forecast model to "fill in the blanks" for what's missing.
Meanwhile, a few weeks ago the 20th-Century Reanalysis Project reported on recent results of the longest-term weather data reanalysis project yet, collecting every scrap of available weather data from 1871-2008 and running them through a weather forecast model to "fill in the blanks" for what's missing.
A salient finding from this study: changes in the North Atlantic Oscillation (also see the North Atlantic Oscillation theme site) appear to be driven throughout the study period primarily by natural variability. In other words, the reanalysis isn't seeing an effect of global warming on variability in the NAO.
The reanalysis data go back to 1871 — but as they go back in time, they get thinner and thinner. Most data prior to the 1950s are from the surface only. The reanalysis model fills in the missing data. So the large majority of data in the pre-1950s reanalysis are created by the model.
Meanwhile, the Nature studies are looking at an entirely different kind of variability, i.e. frequency of extreme precipitation events in the UK (one study) and the Northern Hemisphere (the second study). (It's worth jumping to the actual articles from the links given on the Nature news page.) These studies compare observational data with results from simulation models with and without anthropogenic forcing (i.e. greenhouse gases and other human influences on climate). The results: (a) natural variability alone can't account for the increased northern hemisphere precipitation in the second half of the 20th century, and (b) anthropogenic factors, added to the simulation models, doubled the risk of the floods experienced in the UK in 2000.
This, combined with the comments on the two Nature pieces, make for a lovely skeptic paradox. The skeptics are very happy with the results from the model-driven reanalysis data which (they think) confirm their views. (Another nail in the coffin of AGW, one wrote.) But they roundly reject the idea that simulation models could explain the significant increase in extreme precipitation.
By the way, Piers Corbyn, mentioned in the Kevin Crean comment on the Nature news page, runs a commercial long-term weather prediction service in the UK using his own "solar/lunar" model, whose details he will not reveal and which has never been peer reviewed. He's had some notable successes in forecasting major storms long in advance (months). He places bets on his own forecasts (and sometimes wins). He's a skeptic in the Christopher Monckton vein. (Monckton, by the way, claims to be a hereditary member of the House of Lords, but the Lords are having none of it.)
By the way, Piers Corbyn, mentioned in the Kevin Crean comment on the Nature news page, runs a commercial long-term weather prediction service in the UK using his own "solar/lunar" model, whose details he will not reveal and which has never been peer reviewed. He's had some notable successes in forecasting major storms long in advance (months). He places bets on his own forecasts (and sometimes wins). He's a skeptic in the Christopher Monckton vein. (Monckton, by the way, claims to be a hereditary member of the House of Lords, but the Lords are having none of it.)
I'm going to be working on an op-ed about this over the weekend. Comments welcome.
Friday, January 28, 2011
UN panel sees low/no-cost path to massive greenhouse gas cuts
Here's what could be good news if policymakers were paying attention. The UN Industrial Development Organization (UNIDO) reported a few days ago that a relatively inexpensive combination of renewable energy and energy-efficiency improvements could go far to meeting emissions reduction goals related to climate change, potentially buying time to introduce carbon capture and storage technologies.
Note that this isn't the Intergovernmental Panel on Climate Change, but an unrelated UN agency.
Cost-effective renewable energy could supply 21 per cent of all industrial energy by 2050, providing ten per cent of all reductions needed to counter a potential future of devastating droughts, floods, desertification, rising oceans, ever more powerful storms, shrinking glaciers and other possible effects of climate change.The industrial efficiency measures, in particular, are no-brainers or what are sometimes called "no-regrets" strategies, since they cut industry costs while saving energy (and reducing carbon outputs) at the same time. The report notes that renewable sources won't be cost-competitive in places (such as the USA...) where fossil fuels are subsidized. If subsidies are eliminated, renewables are already competitive, and they're already clear winners where carbon outputs are priced.
At nearly two gigatonnes of CO2, this represents 25 per cent of the total expected emission reductions of the industry sector – equivalent to the total current CO2 emissions of France, Germany, Italy and Spain, or around one third of current emissions in the United States.
Industrial energy efficiency potential worldwide amounts to 26 per cent, with that in developing countries nearly twice as high as in developed nations, according to the reports. [news article; full report]
Note that this isn't the Intergovernmental Panel on Climate Change, but an unrelated UN agency.
Wednesday, January 19, 2011
~1000 ppm and ~30°C global average temps by 2100?
In this week's Science, NCAR climatologist Jeff Kiehl presents the case that when Earth's atmosphere hits 1000 ppm of carbon dioxide — which will happen around 2100 on a business-as-usual scenario — the global average temperature will reach 30°C. That's about twice today's global average of ~16°C. He bases this conclusion on what's known about previous periods in Earth's history over the last 100 million years.
30°C would amount to a re-run of the Cretaceous, with most surface ice melted away and huge increases in sea level.
Kiehl is no credulous consumer of model results. A few years ago, he was a vocal critic of the practice of tuning climate models. He raised the question of how overall climate model projections for CO2 doubling varied by only a factor of two, when those same models contained critical aerosol submodels that varied by a factor of three.
Here's his argument:
The atmospheric CO2 concentration currently is 390 parts per million by volume (ppmv), and continuing on a business-as-usual path of energy use based on fossil fuels will raise it to ∼900 to 1100 ppmv by the end of this century ...Recent reconstructions of atmospheric CO2 concentrations through history indicate that it has been ∼30 to 100 million years since this concentration existed in the atmosphere... The data also reveal that the reduction of CO2 from this high level to the lower levels of the recent past took tens of millions of years. Through the burning of fossil fuels, the atmosphere will return to this concentration in a matter of a century. Thus, the rate of increase in atmospheric CO2 is unprecedented in Earth's history. [full article]
Kiehl goes on to discuss what happened at a previous CO2 peak of ~1000 ppm, around 35 million years ago. That peak resulted in tropical warming of 5° to 10°C, and much more warming in the polar regions — up to 15°-20°C. (Global warming is well understood to vary by latitude, with the poles warming far more than the equator. That's because the climate system functions to transport incoming solar heat to the poles, where more of it can be re-radiated into space.)
What can we learn from Earth's past concerning the climate's sensitivity to greenhouse gas increases? Accounting for the increase in CO2 and the reduction in solar irradiance, the net radiative forcing—the change in the difference between the incoming and outgoing radiation energy–of the climate system at 30 to 40 Ma [million years ago] was 6.5 to 10 W m−2 with an average of ∼8 W m−2. A similar magnitude of forcing existed for other past warm climate periods, such as the warm mid-Cretaceous of 100 Ma. ...The global annual mean temperature at this time can be estimated to be ∼31°C, versus 15°C during pre-industrial times (around 1750). Thus, Earth was ∼16°C warmer at 30 to 40 Ma.
Kiehl finishes with a disturbing conclusion. It may be, he suggests, that model calculations of the climate's sensitivity to greenhouse gases have underestimated that sensitivity by a factor of two or more. If true, our grandchildren — even, for many of us, our children — are in for a truly cataclysmic heat wave.
Saturday, January 15, 2011
Science review of A Vast Machine
A review by Richard Somerville just came out. You can see it here.
In the same review, Somerville discusses philosopher Eric Winsberg's new book Science in the Age of Computer Simulation. Winsberg is one of a few intrepid philosophers who have taken up the challenge of understanding the logic of simulation and modeling, which lie at the core of modern science (and which I discuss extensively in A Vast Machine.)
From the review:
I'm afraid, though, that it's still trailing the bleeding edge — we've entered an age of data-intensive science, which presents its own epistemic challenges: for example, how much does theory matter when statistical analysis of huge datasets reveals strong correlations? If predictive power is your main goal, sometimes data can take the place of explanation. (Not sure I actually believe this, but it's a compelling point of view.) Take a look at Hey et al., The Fourth Paradigm if this kind of thing interests you.
In the same review, Somerville discusses philosopher Eric Winsberg's new book Science in the Age of Computer Simulation. Winsberg is one of a few intrepid philosophers who have taken up the challenge of understanding the logic of simulation and modeling, which lie at the core of modern science (and which I discuss extensively in A Vast Machine.)
From the review:
Winsberg suggests that philosophy of [contemporary] science... ought to concern itself with the subject of simulating complex phenomena within existing theory, as opposed to its traditional focus on the creation of novel scientific theories. Winsberg concludes,Philosophy has been trailing the actual state of science for a long time now, so it's good to see this kind of work coming out.
[W]hat we might call the ontological relationship between simulations and experiments is quite complicated. Is it true that simulations are, after all, a particular species of experiment? I have tried to argue against this claim, while at the same time insisting that the differences between simulation and experiment are more subtle than some of the critics of the claim have suggested. Most important, I have tried to argue that we should disconnect questions about the identity of simulations and experiments from questions of the epistemic power of simulations.
I'm afraid, though, that it's still trailing the bleeding edge — we've entered an age of data-intensive science, which presents its own epistemic challenges: for example, how much does theory matter when statistical analysis of huge datasets reveals strong correlations? If predictive power is your main goal, sometimes data can take the place of explanation. (Not sure I actually believe this, but it's a compelling point of view.) Take a look at Hey et al., The Fourth Paradigm if this kind of thing interests you.
Friday, January 14, 2011
If the globe is warming, why is it snowing so much?
Georgia and Florida hardly ever get snow, but they got dumped on this week. 49 out of the 50 states, in fact, had snow. What's going on?
Simple answer on the global scale: warmer air means more evaporation from oceans, lakes and rivers. More evaporation means there's more water in the air — so more precipitation (including snow) is to be expected. Snow is just frozen rain.
On local and regional scales, though, the real question isn't "why is it snowing?" but "why is it cold?" Strangely enough, here too the best answer may be "because of global warming."
Here's a very clear explanation by Judah Cohen in the New York Times:
...the overall warming of the atmosphere is actually creating cold-weather extremes. Last winter, too, was exceptionally snowy and cold across the Eastern United States and Eurasia, as were seven of the previous nine winters.
For a more detailed explanation, we must turn our attention to the snow in Siberia.
Annual cycles like El Niño/Southern Oscillation, solar variability and global ocean currents cannot account for recent winter cooling. And though it is well documented that the earth’s frozen areas are in retreat, evidence of thinning Arctic sea ice does not explain why the world’s major cities are having colder winters.
But one phenomenon that may be significant is the way in which seasonal snow cover has continued to increase even as other frozen areas are shrinking. In the past two decades, snow cover has expanded across the high latitudes of the Northern Hemisphere, especially in Siberia, just north of a series of exceptionally high mountain ranges, including the Himalayas, the Tien Shan and the Altai.
The high topography of Asia influences the atmosphere in profound ways. The jet stream, a river of fast-flowing air five to seven miles above sea level, bends around Asia’s mountains in a wavelike pattern, much as water in a stream flows around a rock or boulder. The energy from these atmospheric waves, like the energy from a sound wave, propagates both horizontally and vertically.
As global temperatures have warmed and as Arctic sea ice has melted over the past two and a half decades, more moisture has become available to fall as snow over the continents. So the snow cover across Siberia in the fall has steadily increased.
The sun’s energy reflects off the bright white snow and escapes back out to space. As a result, the temperature cools. When snow cover is more abundant in Siberia, it creates an unusually large dome of cold air next to the mountains, and this amplifies the standing waves in the atmosphere, just as a bigger rock in a stream increases the size of the waves of water flowing by.
The increased wave energy in the air spreads both horizontally, around the Northern Hemisphere, and vertically, up into the stratosphere and down toward the earth’s surface. In response, the jet stream, instead of flowing predominantly west to east as usual, meanders more north and south. In winter, this change in flow sends warm air north from the subtropical oceans into Alaska and Greenland, but it also pushes cold air south from the Arctic on the east side of the Rockies. Meanwhile, across Eurasia, cold air from Siberia spills south into East Asia and even southwestward into Europe.
That is why the Eastern United States, Northern Europe and East Asia have experienced extraordinarily snowy and cold winters since the turn of this century. Most forecasts have failed to predict these colder winters, however, because the primary drivers in their models are the oceans, which have been warming even as winters have grown chillier. They have ignored the snow in Siberia.
...It’s all a snow job by nature. The reality is, we’re freezing not in spite of climate change but because of it.Full article is here.
2010: the hottest year on record
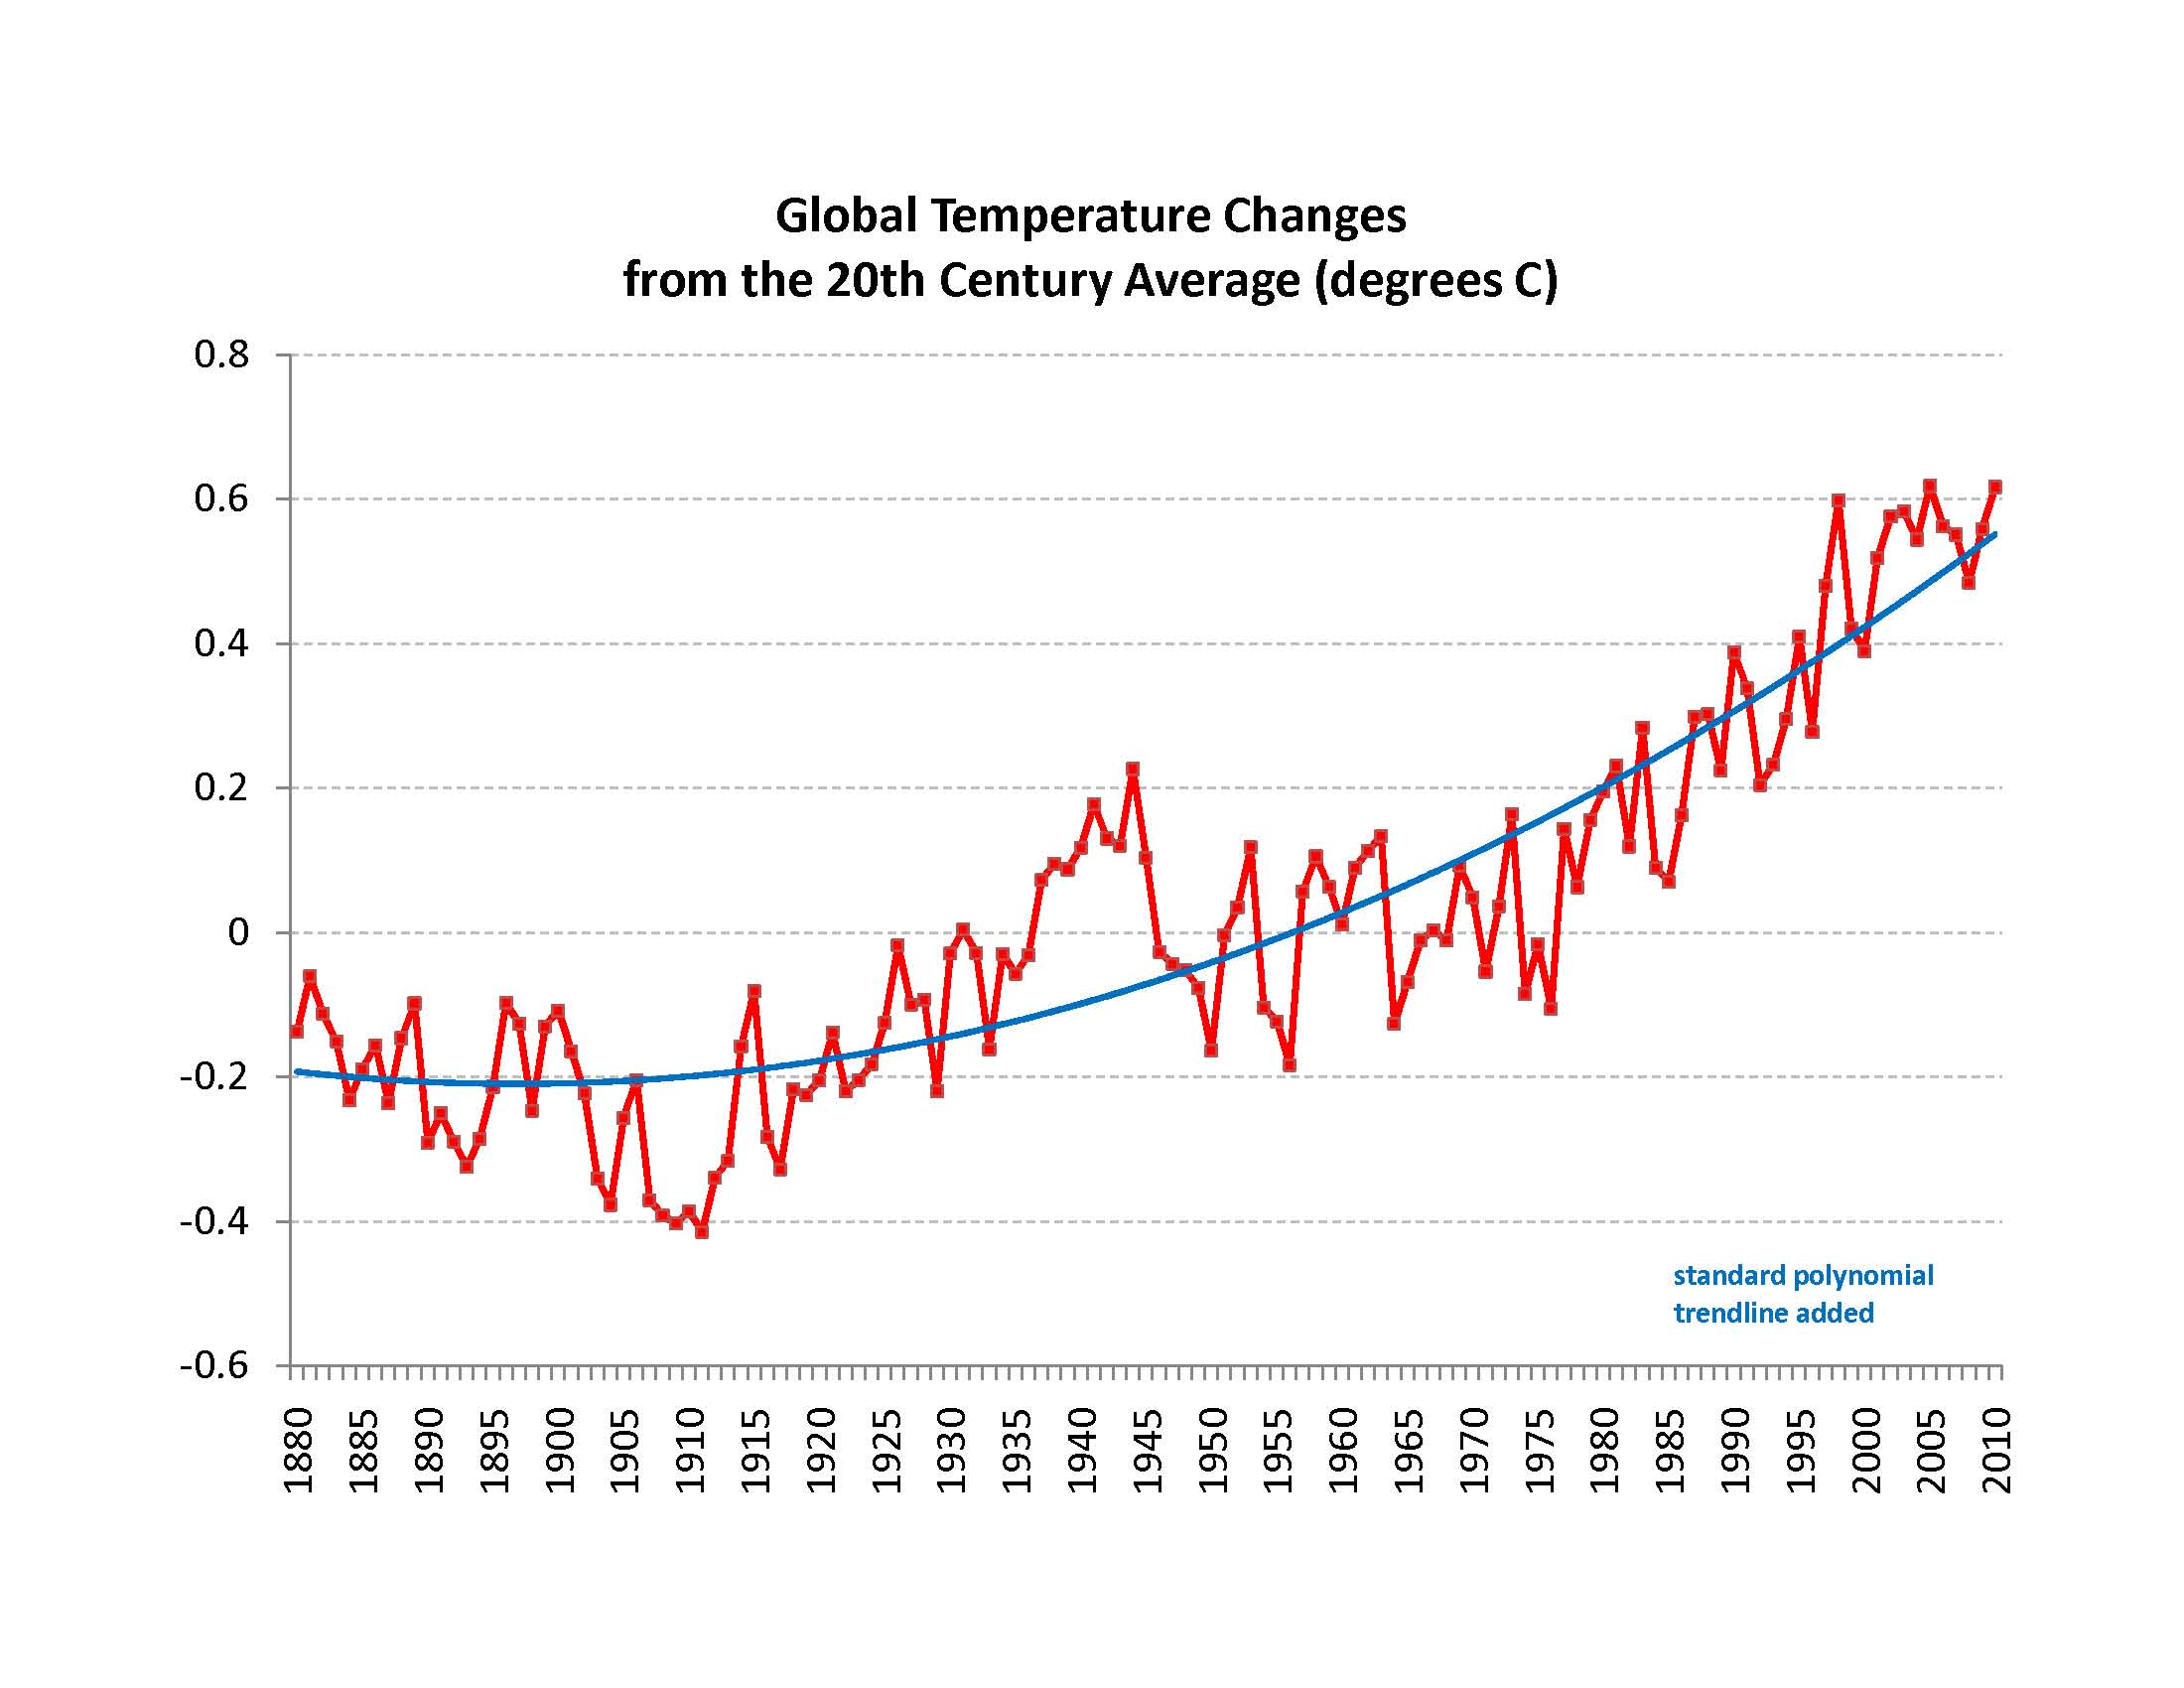
The graph says it all, really, but if you want to know more, see Peter Gleick's article in the Huffington post.
Thursday, January 13, 2011
ASLI award for A Vast Machine: Best History Book of 2010
Got notified this morning that the Atmospheric Science Librarians International (ASLI) has chosen A Vast Machine for its 2010 ASLI Choice Award (History category). The citation mentions "insightful analysis of the models and data that form the basis of our understanding of climate change."
It will receive a plaque in Seattle during the American Meteorological Society meeting on January 26th. (Unfortunately, I won't be able to be there in person — though I truly wish I could!)
This award is doubly meaningful to me. First, numerous atmospheric science librarians and archivists around the world contributed to my research for A Vast Machine. I couldn't have done it without them; there are things you just can't find, or even find out about, without a good librarian. In fact, though she probably doesn't remember it, the librarian who notified me about the award helped me back in 2000, when I spent several days in Toronto at Environment Canada's library, dredging up old WMO documents. (Among other things, she found someone to xerox documents for me, way back in those ancient times when we still xeroxed things...)
Second, I teach in a School of Information, which began its history as a library school and still grants accredited degrees in library science. During my 12 years here, I've grown to appreciate the towering role of libraries and librarians in the history of information. That role's changing, but it's alive and well, even in the age of Google.
Subscribe to:
Posts (Atom)